
Guide Education and expert content for WordPress
Create Interactive Diagrams in WordPress
Turn technical, scientific and educational graphics into guided explanations. Let users explore components, stages and relationships directly on the visual, instead of searching through a long block of text below it.
In short
- Explain each element exactly where it appears
- Build from diagrams, slides, illustrations and renders you already have
- Manage the complete experience inside WordPress without custom development
Figure 1. An interactive diagram in WP InSpot for WordPress. Each segment is a zone: two of them open a nested workspace that breaks the group down further, and the third explains itself in place.
Make complex visuals easier to understand
A dense diagram often forces readers to split their attention. They inspect one part of the image, move to a paragraph or legend elsewhere on the page, then return to the graphic and try to find the same element again. The explanation may be accurate, but the reading path creates unnecessary friction.
WP InSpot keeps context and explanation together. A reader can select a component, stage, layer or area and open the relevant description exactly where that element sits. The original diagram remains visible as the common reference point.
Guide users from the overview to the detail
Start with the complete system, process or illustration. A zone can explain one element immediately, open a WordPress page, follow a source link or lead into another workspace with a more detailed diagram. This makes it possible to build a guided learning path without flattening every level of information into one overloaded graphic.
- System overview to subsystem or component
- Process diagram to stage, instruction or supporting material
- Scientific illustration to structure, function or source
- Architecture visual to layer, room, material or technical detail
Breadcrumbs and back navigation preserve the route between connected views, so users can explore deeper explanations and return to the wider context. The tutorials walk through connected views with nested workspaces step by step.
Add interaction to diagrams you already have
Use a technical diagram, training slide, medical illustration, mechanical drawing, architecture render or process graphic from the WordPress Media Library. Draw rectangular, circular or polygonal interactive zones (hotspots) over the exact elements that need explanation.
Each zone can show a tooltip, popup, modal or side drawer. It can display text, open WordPress content, follow an internal or external link or continue into a nested workspace. The source visual does not need to be rebuilt as a custom application before it becomes explorable.
Generate a diagram index from the same hotspots
Some users will explore the visual directly. Others will prefer a structured list of components, stages or terms. WP InSpot can generate an optional HTML Table View from the actionable zones in the workspace, so the interactive diagram and its index use the same configured elements.
Every actionable zone can become a row, whether it opens text, a WordPress page, a link or another workspace. If a zone is not connected to a WordPress post or entity, the table can still use the zone label, identifier and configured values.
Hovering a row highlights the corresponding element on the diagram. Clicking the row triggers the same action as clicking the zone itself: it can open an explanation, display a popup or drawer, follow a reference link or move into a more detailed workspace.
The table is server-rendered HTML, so component names, stages, terms and selected metadata remain readable to visitors and search engines instead of being locked inside an image. Column sets can be assigned at workspace level, inherited by nested views and overridden where a specific diagram needs different fields. The documentation covers the WP InSpot Table View column keys and inheritance rules in full.
How to create an interactive diagram in WordPress
- Add the source visual. Create a workspace and choose an approved diagram, slide, illustration, image or render from the WordPress Media Library.
- Mark the important elements. Draw zones over components, process stages, structures, labels or areas that require explanation.
- Assign the right interaction. Show concise text, open a popup, modal or drawer, link to a WordPress page or continue into another workspace.
- Add Table View (optional). Generate a diagram index from actionable zones, choose its columns and verify row-to-zone highlighting and actions.
- Publish and test. Add the workspace with the Gutenberg block or shortcode, then test the complete path on desktop, mobile and keyboard navigation.
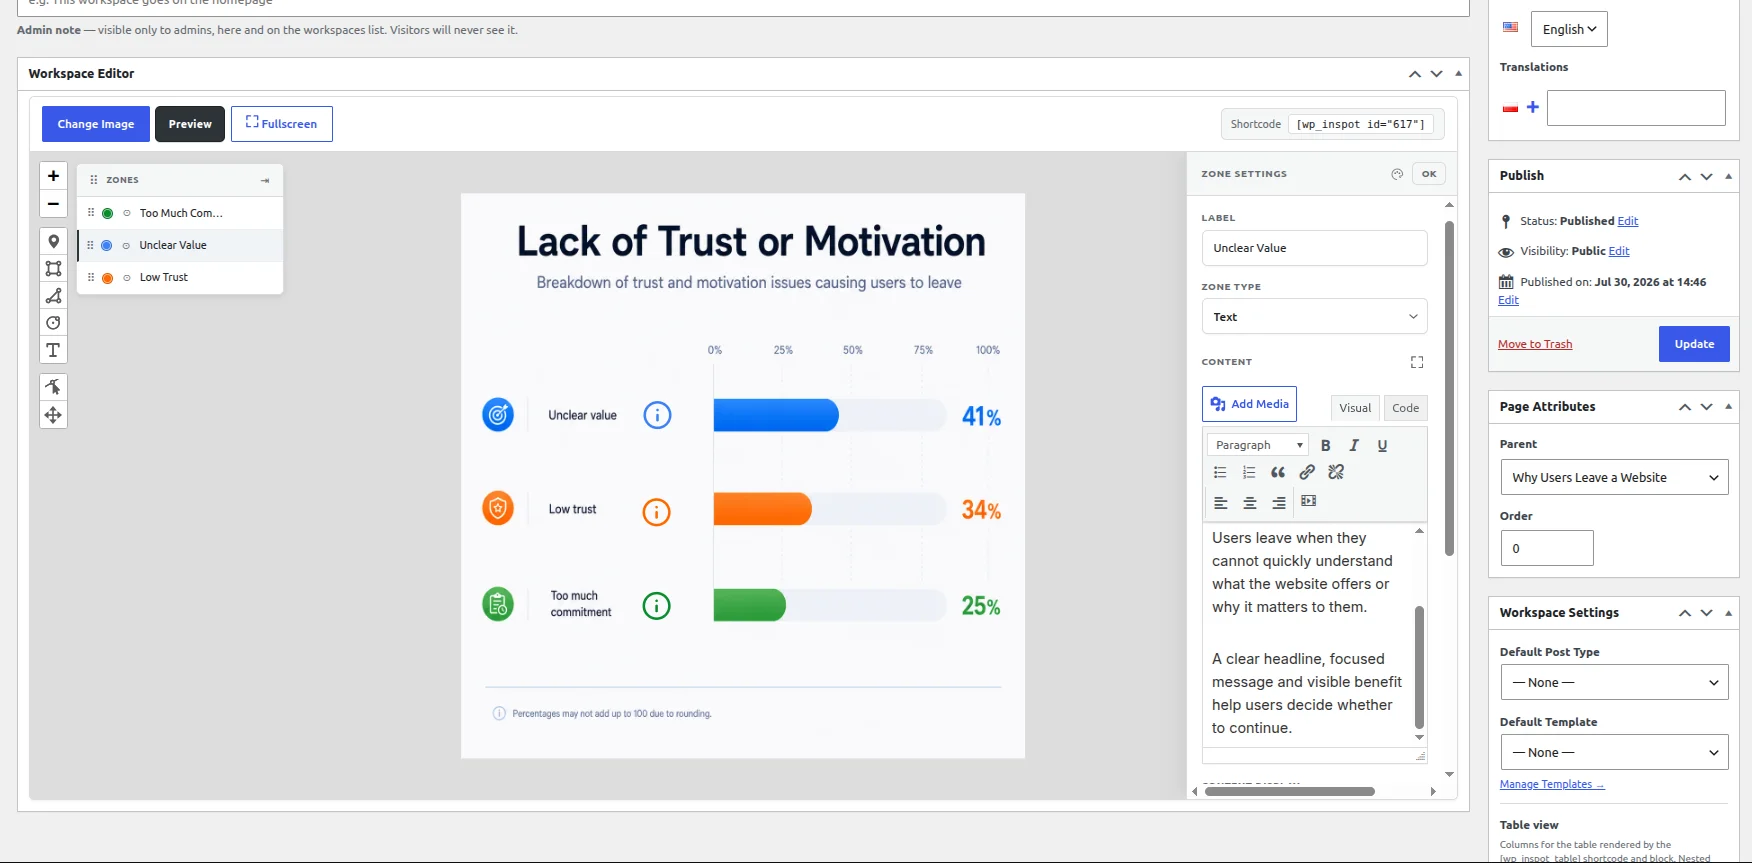
Figure 2. Every step of an interactive diagram happens in wp-admin: zones are drawn on the source visual, and each one is given the action it should run.
Built for education, training and expert communication
Technical and scientific diagrams
Explain systems, structures, experiments and relationships without separating the diagram from its terminology. Connect each element to definitions, supporting pages, sources or a deeper visual view.
Process diagrams and training materials
Turn a process graphic or training slide into a guided sequence. Each stage can reveal instructions, responsibilities, warnings, examples or the next level of detail while the whole process stays visible.
Medical and mechanical illustrations
Add contextual explanations to anatomy images, equipment diagrams, exploded views and service illustrations. Publishers remain responsible for expert review, safety information and the accuracy of every description.
Architecture explanations
Use plans, sections, elevations and renders to explain spatial decisions, construction layers, materials, installations or project details. Link the overview to more focused diagrams when one image cannot carry the complete explanation.
Step-by-step visual learning paths
Connect several workspaces into a sequence that moves from overview to detail. Users can follow the intended path or explore the elements most relevant to them without losing their position.
More interactive image examples from other industries follow the same structure.
Use approved visuals without rebuilding them from scratch
A custom interactive diagram can require front-end development, responsive coordinate logic, content modelling and repeated code changes whenever the visual or explanation is updated. Recreating an approved technical illustration in another authoring system can also introduce inconsistencies.
WP InSpot adds an interaction layer to the asset already used by the organisation. The diagram remains the visual source, while zones, explanations, WordPress content and connected views can be managed separately.
- No custom JavaScript interface required for the standard interaction flow
- No need to redraw the source diagram inside the plugin
- Detailed explanations can remain in existing WordPress content
- The same workspace can combine visual exploration with an HTML index
Know when another tool is the better fit
Use a dedicated chart plugin when the visual must be generated from changing datasets. Use a diagram editor when users need to draw shapes and connectors. Use an LMS or H5P-style tool for quizzes, scoring, learner tracking and assessments. Use CAD, BIM or simulation software when the project requires model data, precise measurements, live calculations, animated states or engineering interaction.
WP InSpot serves a narrower need: turn a finished image or diagram into a maintainable, connected explanation inside WordPress. It does not create or validate the underlying expert content.
| What you need | Where it belongs |
|---|---|
| Clickable explanations, connected views and an index built on a finished diagram | WP InSpot, inside WordPress |
| A visual generated from changing datasets | A dedicated chart plugin |
| Drawing shapes and connectors | A diagram editor |
| Quizzes, scoring, learner tracking and assessments | An LMS or H5P-style tool |
| Model data, precise measurements, live calculations or animated states | CAD, BIM or simulation software |
Responsive and accessibility-conscious
Complex diagrams need deliberate mobile treatment. Use concise zone labels and presentation modes that fit smaller screens, then test real content at representative widths rather than relying on an empty demo.
Provide descriptive alternative text for the complete image, visible keyboard focus and a logical focus order. The HTML diagram index offers a text-based route to the same actionable elements. Final WCAG conformance still depends on the page design, source content and testing of the complete website.
For agencies: turn expert assets into a repeatable WordPress service
WP InSpot is managed in WordPress and published with a Gutenberg block or shortcode. An agency can connect existing diagrams to approved pages, documentation and source material without maintaining a separate hosted presentation platform.
The delivery process is repeatable: confirm the learning objective, obtain the approved source visual, define the information hierarchy, prepare or connect WordPress content, draw zones, configure the diagram index and test the final experience with the client or subject-matter expert. Multi-site licences are listed on the WP InSpot pricing page.
Frequently asked questions
How do I create an interactive diagram in WordPress?
Create a WP InSpot workspace, add an existing diagram or illustration, draw zones over the elements you want to explain and assign an action to each zone. Publish the workspace with the Gutenberg block or shortcode.
Can I use an existing technical or educational graphic?
Yes. A workspace can start from a diagram, slide, illustration, image or render already available in the WordPress Media Library. WP InSpot adds the interactive layer without redrawing the source visual.
Can one diagram lead to more detailed diagrams?
Yes. A zone can open a nested workspace, allowing a user to move from a system overview to a subsystem, component, process stage or detailed illustration while breadcrumbs and back navigation preserve context.
Can WP InSpot generate a list of diagram elements?
Yes. Actionable zones can become rows in a server-rendered HTML Table View. Hovering a row highlights the corresponding element, while clicking it triggers the same action as the zone.
Is WP InSpot an alternative to H5P or an LMS?
It can create guided visual explanations, but it is not a learning-management or assessment platform. Quizzes, scoring, learner progress and course administration require an LMS, H5P-style tool or separate integration.
Does WP InSpot create flowcharts or technical drawings?
No. It adds interactions to a finished image or diagram. Use a dedicated diagram, CAD or BIM tool to create and edit the underlying visual, then use WP InSpot to explain it in WordPress.
Can it be used for medical or engineering content?
Yes, as a presentation layer for approved illustrations and explanations. WP InSpot does not verify medical, scientific, engineering or safety information, so qualified experts must review the content.
Is the diagram content readable outside the image?
The optional Table View provides a server-rendered HTML index of actionable elements. Essential information should also be written in accessible page content and not exist only as text embedded in the image.
Turn complex diagrams into guided explanations
Use WP InSpot to connect technical, scientific and educational visuals with the explanations, pages and deeper views they need. Start from an approved graphic you already have and publish the first interactive workspace inside WordPress.
Read next: shoppable images for WooCommerce, or the interactive image plugin for WordPress feature tour.